We Scored 860 Website Templates. Here Is What the Data Shows in 2026


Marketplace ratings measure popularity, not quality. Our review data measures both, across 860 scored templates on Webflow, Framer, and Shopify. The 2026 numbers on pricing, free versus paid quality, and design versus code gaps surprised even us.
Template marketplaces publish plenty of numbers. Sales counts, star ratings, download totals, bestseller badges. None of those numbers measure whether a template survives contact with a real project, which is why useful website template statistics are so hard to find in public. Popularity data tells you what got bought. It says nothing about what holds up when a developer opens the file.
Our library holds that missing data. Every one of the 860 templates we've published, 333 Webflow templates, 361 Framer templates, and 166 Shopify themes, carries two independent scores out of 10: a Design Score and a Dev Score, each averaged from multiple professional reviewers. Nothing below an Overall Score of 7.0 gets listed.
This post is the full readout of that dataset as it stands in 2026: score distributions per platform, real average and median prices, the measurable quality gap between free and paid, and where design quality and code quality diverge. Every number comes from our published library, and nowhere else.
How many website templates clear a 7.0 quality bar?
All 860 templates in our library score 7.0 or above, because templates below that threshold are not published at all. Within the library, 29.4% of Webflow templates, 24.9% of Framer templates, and 31.3% of Shopify themes score 9.0 or higher overall. Shopify has the largest share of top-band themes, while Framer has the largest share sitting in the 7.0 to 7.9 range at 43.5%.
Here is the full score-band distribution:
| Score band | Webflow (333) | Framer (361) | Shopify (166) |
|---|---|---|---|
| 9.0 and above | 29.4% | 24.9% | 31.3% |
| 8.0 to 8.9 | 32.7% | 31.6% | 26.5% |
| 7.0 to 7.9 | 37.8% | 43.5% | 42.2% |
The platform averages sit closer together than the distributions suggest. Webflow averages Overall: 8.3/10, Shopify averages Overall: 8.2/10, and Framer averages Overall: 8.2/10 across their respective libraries. What separates them is the shape, not the mean. Shopify's curve is barbell-shaped: a large top band and a large 7.0 to 7.9 band, with the thinnest middle of the three platforms at 26.5%. Framer's curve leans toward the entry band, which tracks with how young its template market still is and how many new creators publish there.
One caveat worth stating plainly: these are statistics about templates that already passed a quality filter. The full population of templates on each platform's marketplace scores lower than this, often much lower. Our data describes the good end of the market, as scored by our review methodology.
What does a website template cost in 2026?
A paid Webflow template averages $79 in our library, with a median of exactly $79 and a range of $24 to $169. A paid Framer template averages $68 with a median of $59, ranging from $19 to $199. Paid Shopify themes are in a different bracket entirely: they average $336 with a median of $360, ranging from $100 to $490.
The Webflow number is striking for how uniform it is. When the average and the median are the same $79, pricing has converged on a norm, and creators price against each other rather than against the work involved. Framer pricing skews differently: the median of $59 sits below the average of $68, which means a smaller group of higher-priced templates, up to $199, pulls the average up while most templates cost less.
If you're weighing template price against everything else a platform costs, hosting, plan tier, and transaction fees included, our platform cost calculator puts these numbers in context. A $336 theme on a store doing real revenue is a smaller line item than a $79 template on a site with no budget behind it.
Why do Shopify themes cost 4 to 5 times more than Webflow or Framer templates?
Shopify themes cost more because they are storefront software, not styled page layouts. A theme ships cart logic, checkout integration, product filtering, collection pages, and a section architecture that merchants configure without touching code, and it has to keep working as Shopify updates its platform. That engineering load shows up directly in our scores: Shopify themes average Dev: 8.5/10, the highest development average of any platform we cover.
The price floor makes the same point. The cheapest paid Shopify theme in our library costs $100, which is more than the average paid template on Webflow or Framer. There is no impulse-buy tier because there is no low-effort way to build a theme that handles real commerce.
The buyer math is different too. A Webflow or Framer template usually launches a marketing site or portfolio. A Shopify theme runs a store that processes orders every day, so a one-time $360 license amortizes quickly. Judged per feature rather than per file, Shopify themes may be the better value of the three.
How big is the quality gap between free and paid templates?
The gap depends heavily on the platform. On Framer, free templates average Overall: 8.0/10 against Overall: 8.3/10 for paid, a gap of just 0.29 points, the smallest we measured. Webflow's gap is 0.62 points (free 7.7, paid 8.4) and Shopify's is 0.69 points (free 7.6, paid 8.3). On every platform, free templates that made our library are genuinely usable. On Framer, they are close to interchangeable with paid ones.
Supply explains most of this. Free templates make up 48% of our Framer library, 175 of 361 templates, because Framer creators publish free work as a portfolio and marketing channel, and the competition pushes quality up. On Webflow only 11% of our library is free (36 templates), and on Shopify just 9% (15 themes). Where free templates are scarce, the ones that exist tend to be lead magnets rather than finished products, and the scores reflect it.
The practical read: if you're building on Framer with no budget, you're barely compromising. Start with the free Framer templates in our library. On Webflow, free can still work, our roundup of the 30 best free Webflow templates proves it, but the 0.62-point gap is real and usually shows up in CMS depth and interaction polish rather than in the homepage.
What does a gap between Design and Dev scores tell you?
A Design versus Dev score gap means the template's visual quality and build quality were judged at different levels, and the direction of the gap tells you what you're actually buying. Shopify has the widest average gap at 0.63 points, with 43 of 166 themes showing a gap of 1.0 or more. Webflow averages a 0.33 gap (13 templates at 1.0+) and Framer just 0.28 (9 templates at 1.0+).
Shopify's gap has a clear direction. Themes there average Design: 8.0/10 against Dev: 8.5/10, meaning the typical theme is engineered better than it is designed. That matches how theme development works: commerce functionality is mandatory and testable, while visual ambition is optional. On Webflow and Framer the two scores are nearly identical on average (8.3 against 8.3, and 8.2 against 8.2), because a single designer-developer usually builds the whole template.
For buyers, the gap is a decision signal. Strong code with weaker design suits teams who plan to restyle anyway, since the hard part is already solid. Strong design with weaker code is the riskier buy: the demo looks right, but customisation surfaces the shortcuts. We flag notable gaps in individual reviews, and our scoring methodology post explains how each axis is judged.
Which categories dominate each platform?
Portfolio and agency work dominates the no-code platforms. 209 of our 333 Webflow templates carry the Portfolio & Agency tag (63%), and on Framer it's 344 of 361, a striking 95%. On Shopify the concentration runs through fashion: 98 of 166 themes (59%) are tagged Fashion & Accessories, the largest specific vertical after the Retail & E-commerce tag that every theme carries by definition.
Templates carry multiple category tags, so these counts overlap, but the concentration is still the story. If you're an agency or freelancer shopping on Framer, you have hundreds of scored options and a serious differentiation problem, since your competitors are choosing from the same pool. If you're building something outside the mainstream, a restaurant site on Framer or a furniture store on Shopify, your realistic shortlist may be a dozen templates, not a hundred.
Thin categories cut both ways. Less choice, but also less sameness: a strong template in an underserved niche makes your site look less like everyone else's. Browsing by category on the Webflow, Framer, and Shopify listings shows exactly how deep each niche runs, and hovering over any card plays a looping screen recording of that template's full homepage, so you can compare an entire category in minutes.
What these website template statistics mean for your next project
Three practical conclusions fall out of the data. First, platform choice matters more than template choice for your budget: the gap between a $59 median Framer template and a $360 median Shopify theme dwarfs any price difference within a platform. Second, free is a real option on exactly one platform: Framer's 0.29-point free-to-paid gap makes it the only place where skipping the purchase costs you almost nothing. Third, on Shopify, read both scores before buying, because 43 themes in our library have a Design versus Dev gap of 1.0 or more, and the demo store won't tell you which side is weak.
The numbers also argue against choosing a platform by template supply alone. Framer has our largest library at 361 templates, but 95% of them chase the same portfolio and agency market. Shopify has our smallest at 166, yet the highest share of themes scoring 9.0 or above. If you're still deciding where to build, our Webflow versus Framer versus Shopify comparison covers the platforms themselves rather than the templates.
How we collected this data
Every number above comes from the published library on BestWebsiteTemplate.com as of early 2026: 860 templates that each passed a multi-reviewer scoring process. Multiple professional designers and developers, each with 10 or more years of industry experience, score every template independently, and the published Design Score and Dev Score are the averaged result. Templates scoring below an Overall Score of 7.0 are not published and are therefore not in this dataset, so all statistics describe the above-threshold market only. We do not sell templates, take commissions from creators, or factor marketplace popularity into scores. The full process is documented on our methodology page.
A visual sample from the library
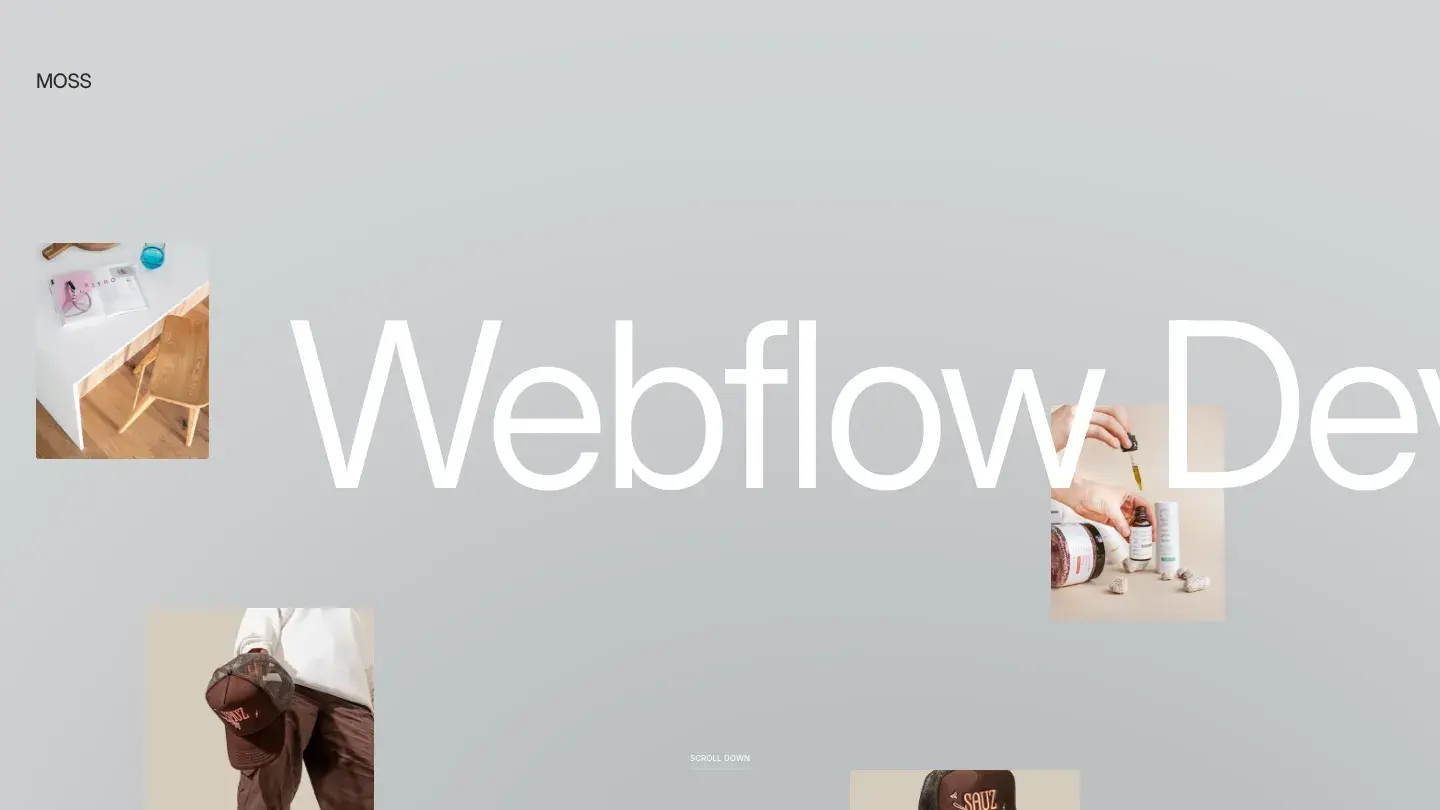
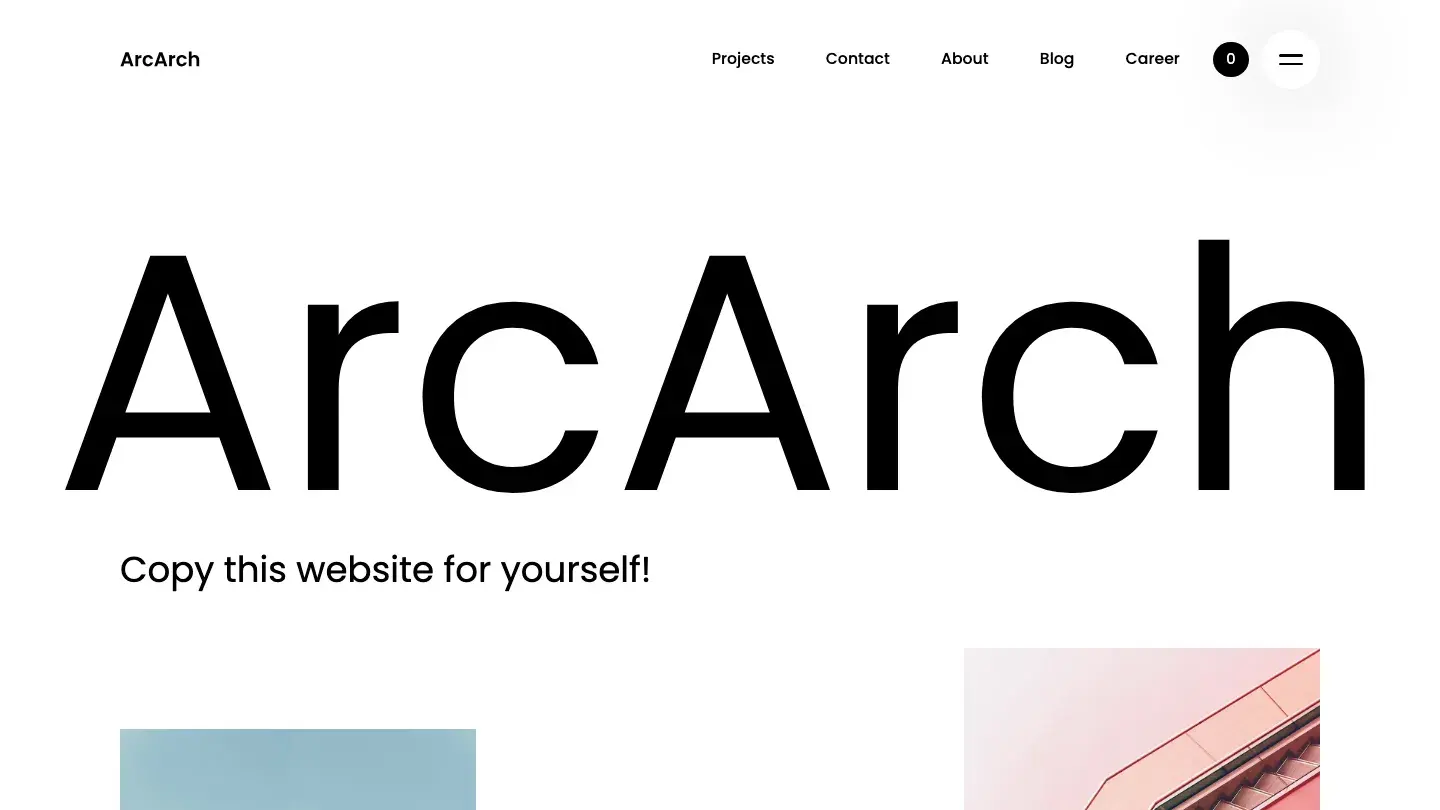
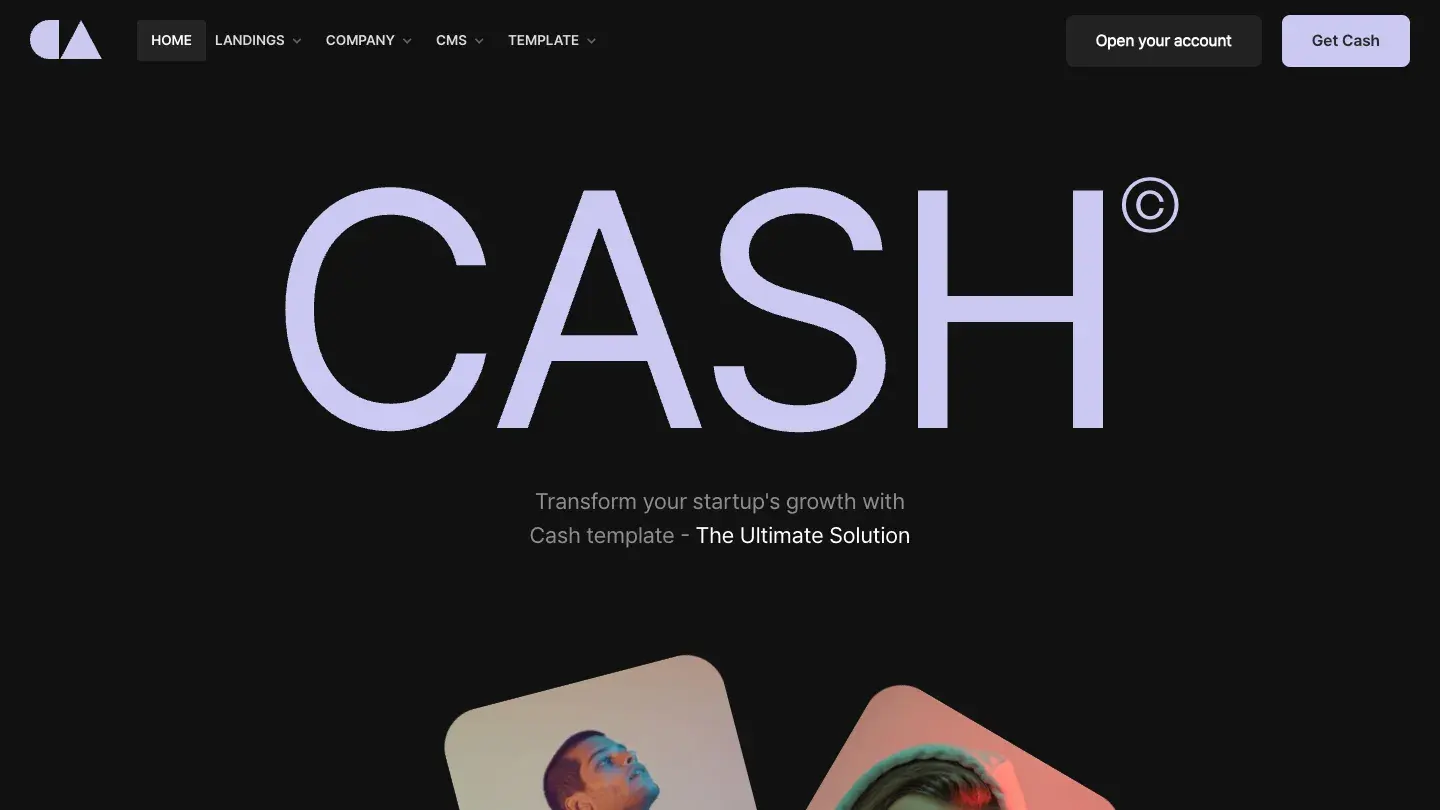
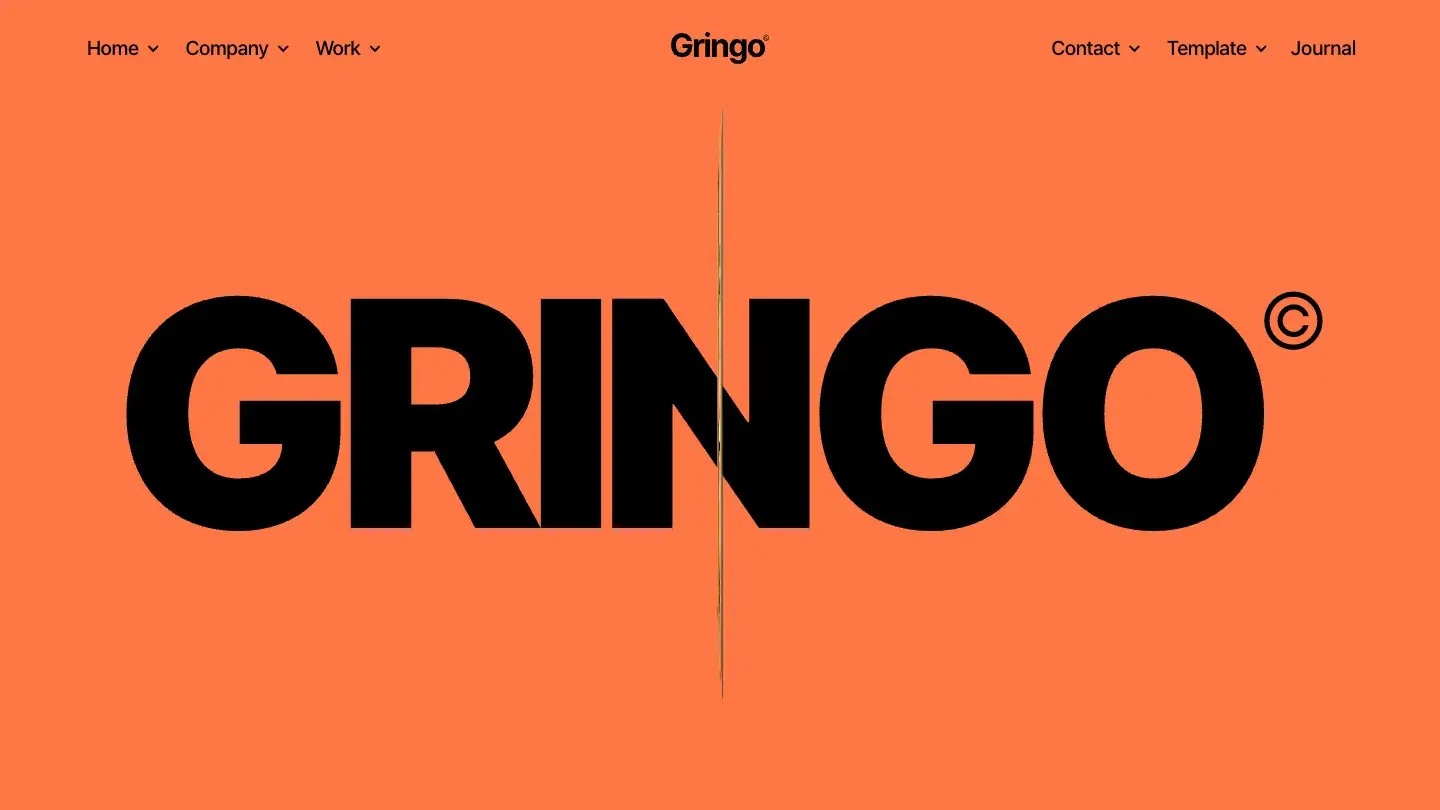
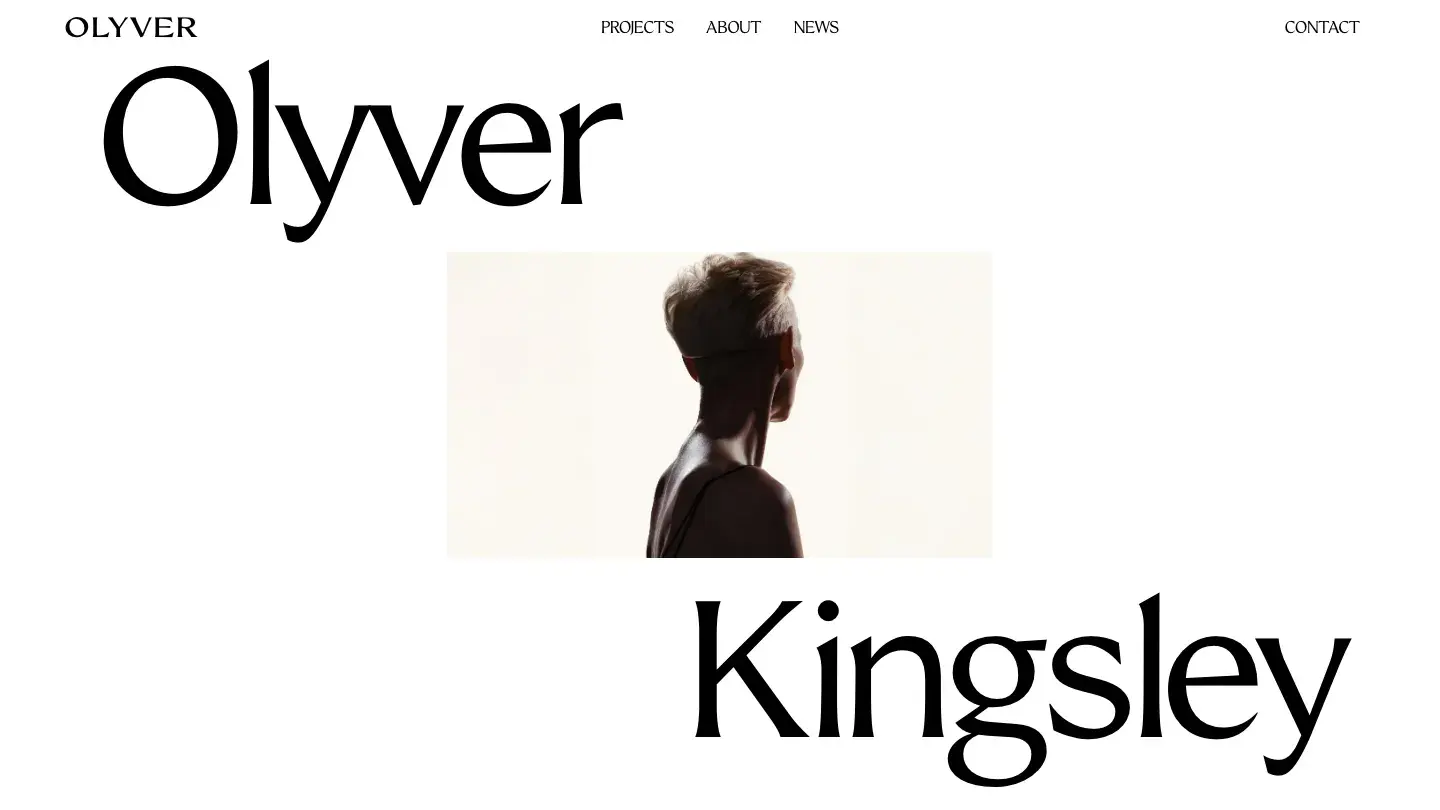
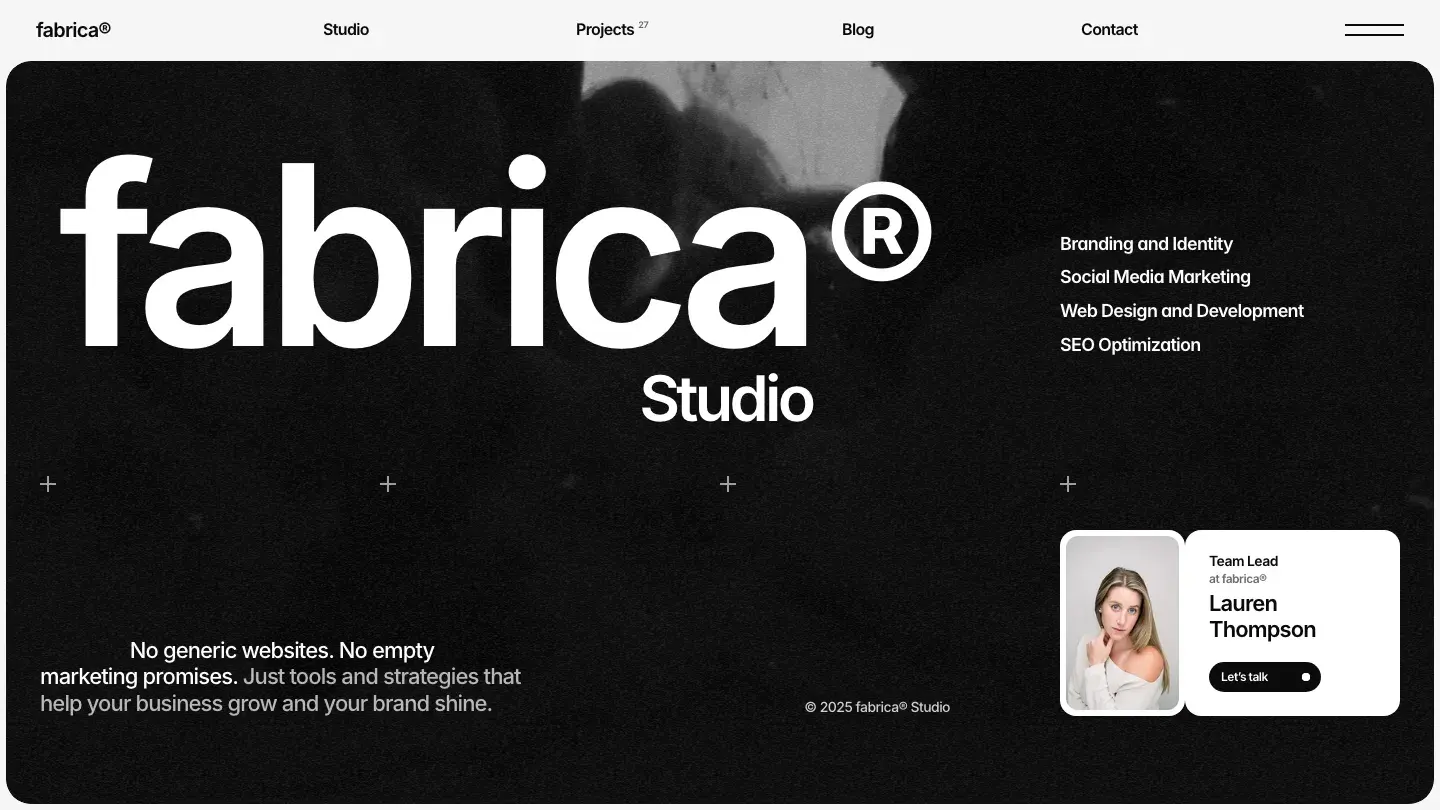
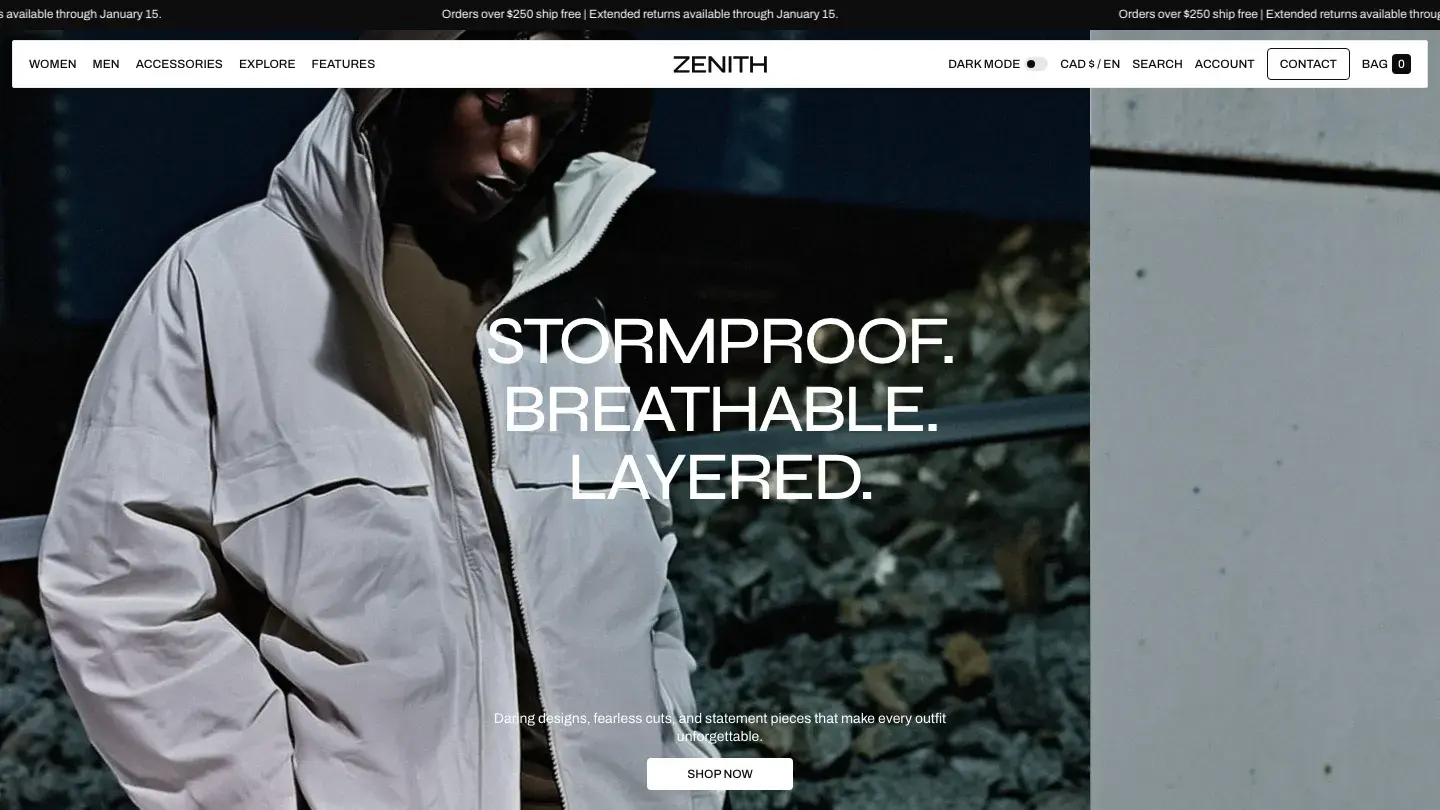
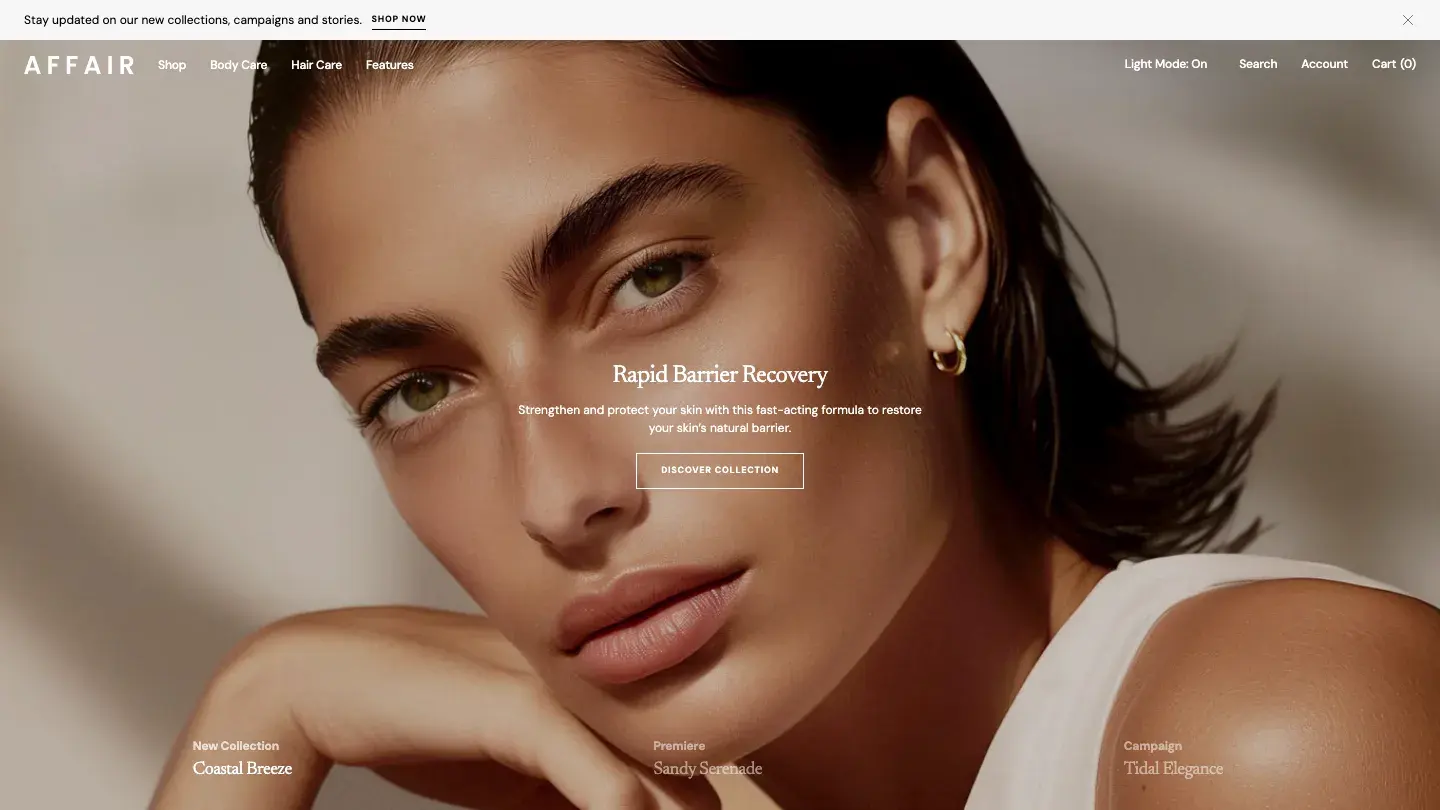
These are some of the highest-scoring templates currently published. Hovering over any card on our listing pages plays a looping screen recording of the homepage.






FAQ
How many website templates has BestWebsiteTemplate.com reviewed?
Our published library contains 860 templates: 333 for Webflow, 361 for Framer, and 166 Shopify themes. Every one scored 7.0 or above overall through our multi-reviewer process. Templates that scored below 7.0 were reviewed but not published, so the true number of templates we've examined is higher than 860.
What is the average price of a website template in 2026?
It depends on the platform. In our library, paid Webflow templates average $79, paid Framer templates average $68 with a $59 median, and paid Shopify themes average $336 with a $360 median. Ranges run from $19 at the low end on Framer to $490 at the top on Shopify.
Are free templates good enough for a real project?
On Framer, usually yes: free templates there average Overall: 8.0/10, only 0.29 points behind paid ones, and they make up 48% of our Framer library. On Webflow and Shopify the free pool is much smaller and the quality gap wider, at 0.62 and 0.69 points respectively, so check the individual scores before committing.
Why are Shopify themes so much more expensive than other templates?
A Shopify theme includes cart, checkout, product filtering, and merchant-configurable sections, and it must stay compatible as Shopify updates its platform. That is far more engineering than a marketing site template requires, which is why Shopify themes average Dev: 8.5/10, the highest of any platform we cover, and why the cheapest paid theme in our library still costs $100.
What does it mean when a template's Design and Dev scores differ by a full point?
It means our design reviewers and development reviewers reached clearly different verdicts on the same product. A higher Dev Score suggests solid code under a plainer surface, which suits buyers who plan to restyle. A higher Design Score suggests an impressive demo that may fight you during customisation. We found 43 Shopify themes, 13 Webflow templates, and 9 Framer templates with a gap of 1.0 or more.
How are the scores on BestWebsiteTemplate.com calculated?
Multiple reviewers, professional designers and developers with 10 or more years of experience, independently score each template on design and development quality without seeing each other's numbers. The published Design Score and Dev Score are the averages of those independent scores. The process is manual, not algorithmic, and is described in full on our methodology page.
How We Score Templates: Our Design and Dev Scoring Methodology
by Davis Kent

15 Best Free Shopify Website Themes 2026
by Maren Brooks
30 Best Free Webflow Website Templates 2026
by Dean Merrick
30 Best Modern Shopify Website Themes 2026
by Thayer Odell

30 Best Free & Paid Framer Website Templates 2026
by Maren Brooks